What is happening to property prices?
2nd May 2023
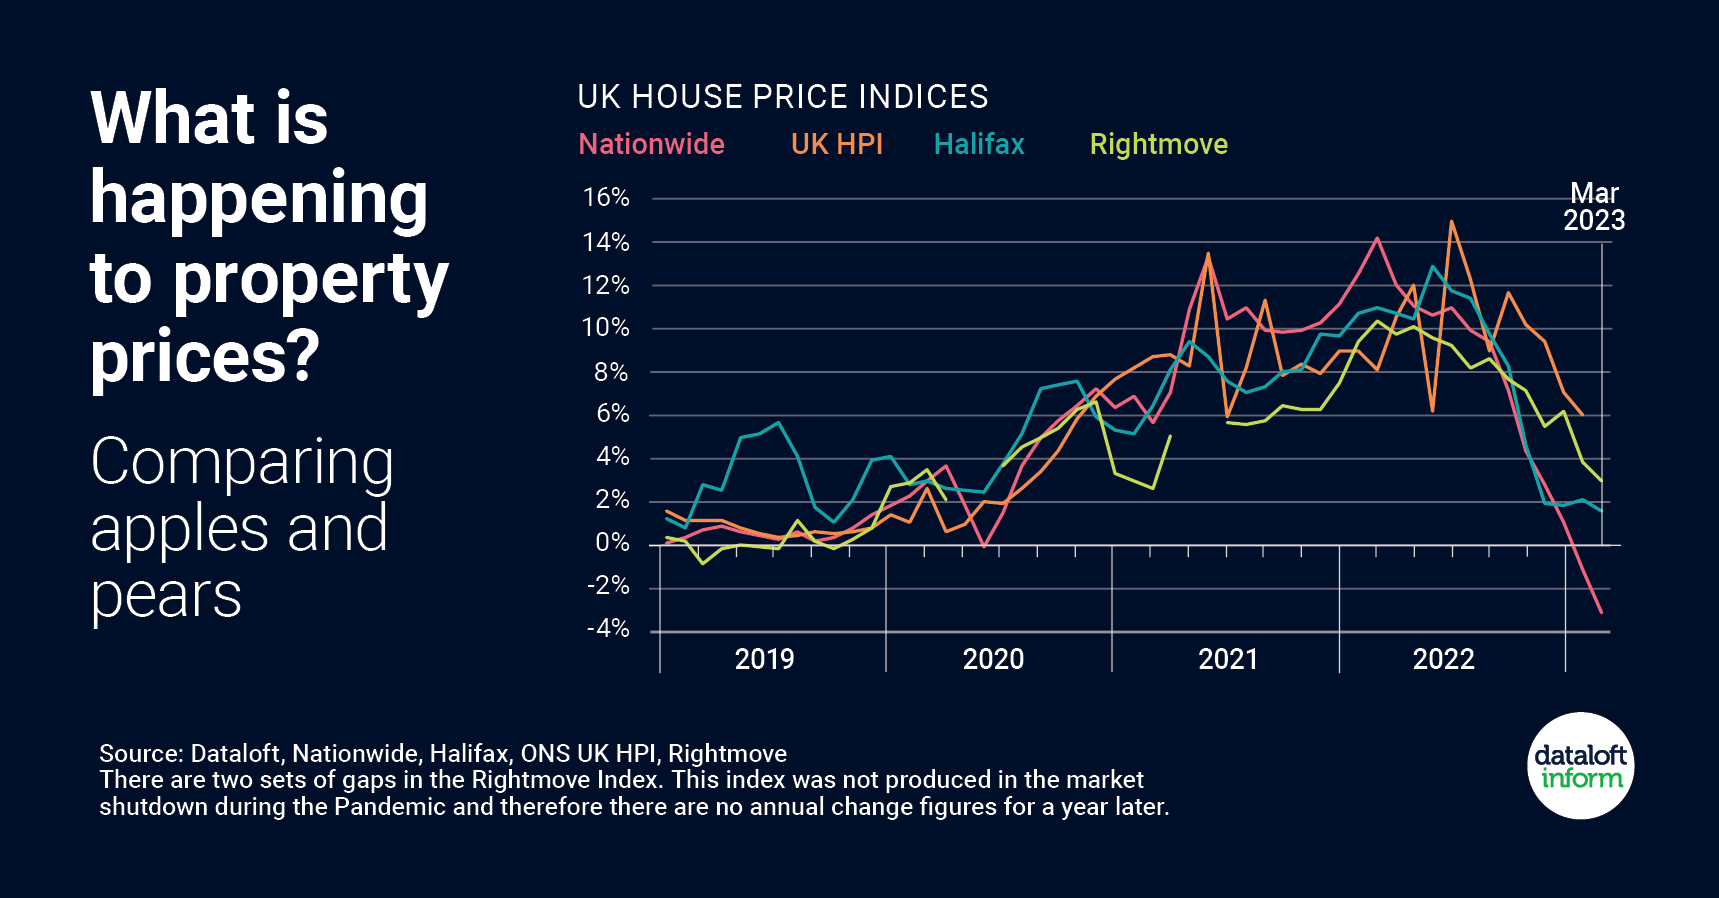
Average UK property prices and annual price growth are published by various organisations. However, the figures are different for each and can cause confusion. This is because the data is calculated in slightly different ways.
Rightmove average prices are the highest, but their index is based on the asking prices of newly listed properties (around 100,000 each month), not on sales prices. In comparison, the ONS UK HPI index uses final sales prices, including for cash and mortgage sales, recorded by the Land Registry. It includes around 80,000-100,000 sales per month.
Halifax and Nationwide use their own mortgage applications at approval stage (around 12,000-15,000 per month). The average price quoted by Nationwide is usually the lowest. The differences in the source of the data, as well as the statistical calculations that make up each index, explains their variations.
Comparing the indexes against each other is like comparing apples with pears. However, despite the variation in methodologies, the overall trend direction noted by each organisation is similar. It is this overall trend which is important when considering what is happening in the current market. Source: Dataloft, Nationwide, Halifax, ONS UK HPI, Rightmove

Renting in Brighton Is Now Cheaper Than Buying: Here’s What That Means for You
19th May 2026
New research from Rightmove has revealed that renting is now cheaper than buying for the average first-time buyer in Great…

Renting could now be cheaper than buying in Brighton
19th May 2026
New research from Rightmove shows that renting is now cheaper than buying for the average first-time buyer in Great Britain…

Brighton Update – Spring/Summer 2026
24th April 2026
Brighton continues to see a mix of positive momentum and notable developments as we move into the spring and summer…