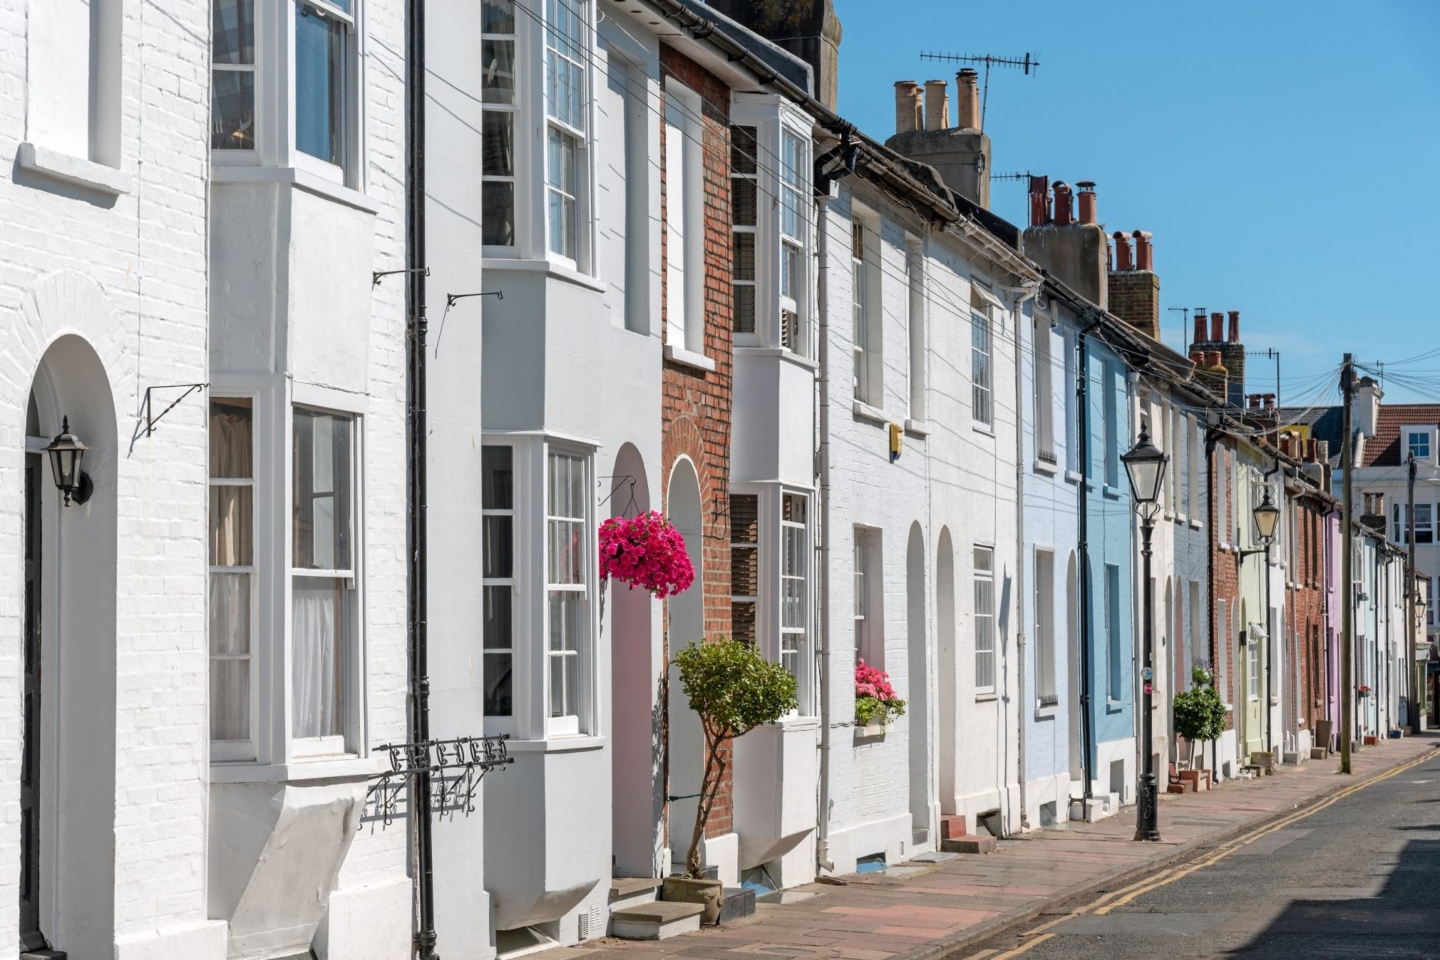
Why buyers love Brighton so much, and why it matters to you
There are few things in life that you can trust more to enrich your family than the property they live in. While this is true in terms of the memories it creates and the special moments it hosts, it’s also true in terms of cold, hard material gain.
Since 2000, the average Brighton home has increased in price by 245.4 per cent. The best performing property type has been flats which have increased by 255.8 per cent, equivalent to £12,300 per year. The reason this particular type of home has outperformed the rest is down to a number of factors, but in essence it’s simply down to this being the home of choice for Brighton residents.
For anyone who has ever spent much time here, the attractions are fairly obvious. A great balance of first-rate housing stock, solid transport accessibility and ready access to the amenities we need the most. It is these factors which explain why our area has outperformed the national market during this period of cooling which has been felt in many parts of the country.
The popularity of Brighton as a place to live is unlikely to diminish any time soon. If you’re considering buying or selling in this area, now is the ideal time. There are great opportunities for buyers and sellers in every corner of the market. As long as you work with a local market expert, you’re destined to win big.
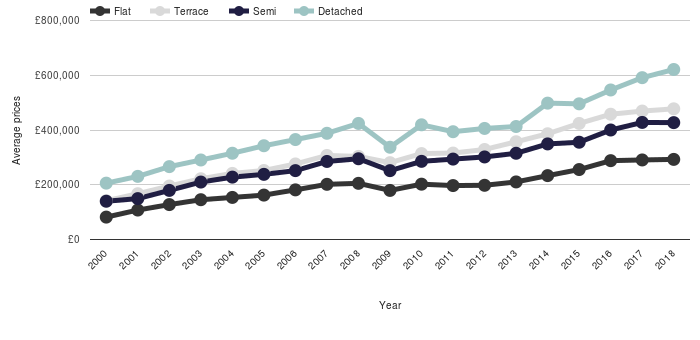
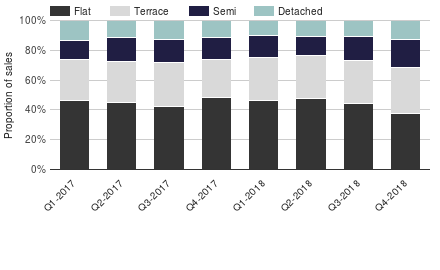
The proportion of sales by house type
For this month’s market update, we’ve decided to take a look at what percentage of total sales each house type accounts for each quarter. Whilst it doesn’t show the actual number of sales, it’s very useful for seeing what each property type is contributing to the total level of transactions.
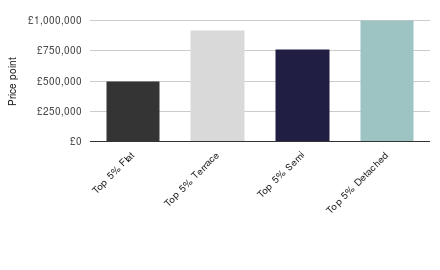
Top 5% of properties in the local area
We were interested in looking at the selling prices of the top 5% of properties in the local market. This chart displays the main house types side-by-side so you can see how they sit relative to one another.
Local tenure patterns
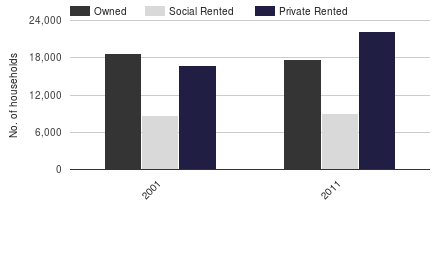
The tenure mix of properties really defines what makes the local market tick. This chart shows how many people own, rent privately and rent from the council or a housing association. It’s very interesting to see how this changed between the last two censuses. In most, but not all of the country, private renting has increased substantially.
9 October 2026
‘Your First Home’: What the New Government Buyer Scheme Could Mean for the Market
On 26 September 2026, the Government announced a new first-time buyer scheme called Your First...

7 October 2026
Freshers’ Fair Gave Us a Head Start on Next Year’s Rental Season
Last week the Coapt team attended the Brighton University’s fresher’s fair to gear up for...
28 September 2026
Renters’ Rights Act: The landlord register is coming – don’t let it catch you out
Another part of the Renters’ Rights Act is on its way, and this one needs...

7 September 2026
The first autumn under the new rental rules: has being a landlord changed more than you realised?
We’re not quite ready to say summer is over just yet, and we certainly don’t...

4 September 2026
Navigating the homebuying process
Buying a home is an exciting prospect, but it can also come with stresses. From...

3 September 2026
A New Prime Minister, A Familiar Face and What Could It Mean for Brighton Landlords?
Housing has quickly emerged as one of the priorities of new Prime Minister Andy Burnham’s...